How to use Top and Rising in Google Trends
Using a saved keyword collection, I explain Google Trends Top scores, Rising growth, and monthly search volume, and how each helps with choosing article topics.
I have been building a workflow that uses Google Trends to help choose article topics. Among the results saved by the tool, one query had a Rising value of 12000%.
When choosing topics, I look at these fields separately: Top shows the relative popularity of related queries, Rising helps find queries that have grown quickly recently, and monthly search volume adds a sense of demand at scale. I use these data to find candidates first, then look at the specific questions and existing content one by one.
What data this collection returned
The input term for this batch was artificial intelligence, with the United States selected as the region and the past 7 days as the time range.
The data were collected through DataForSEO. The table below is an excerpt from the research record saved by the tool.
| Related query | Saved metric | Available monthly search volume |
|---|---|---|
| what is artificial intelligence | Top 58 | Not obtained |
| what is ai | Top 20 | Not obtained |
| law firms adopting artificial intelligence | Rising 12000% | Not obtained |
To check for yourself, open the Trends page for the same input term, the United States, and the past 7 days, then switch between Top and Rising under related queries.
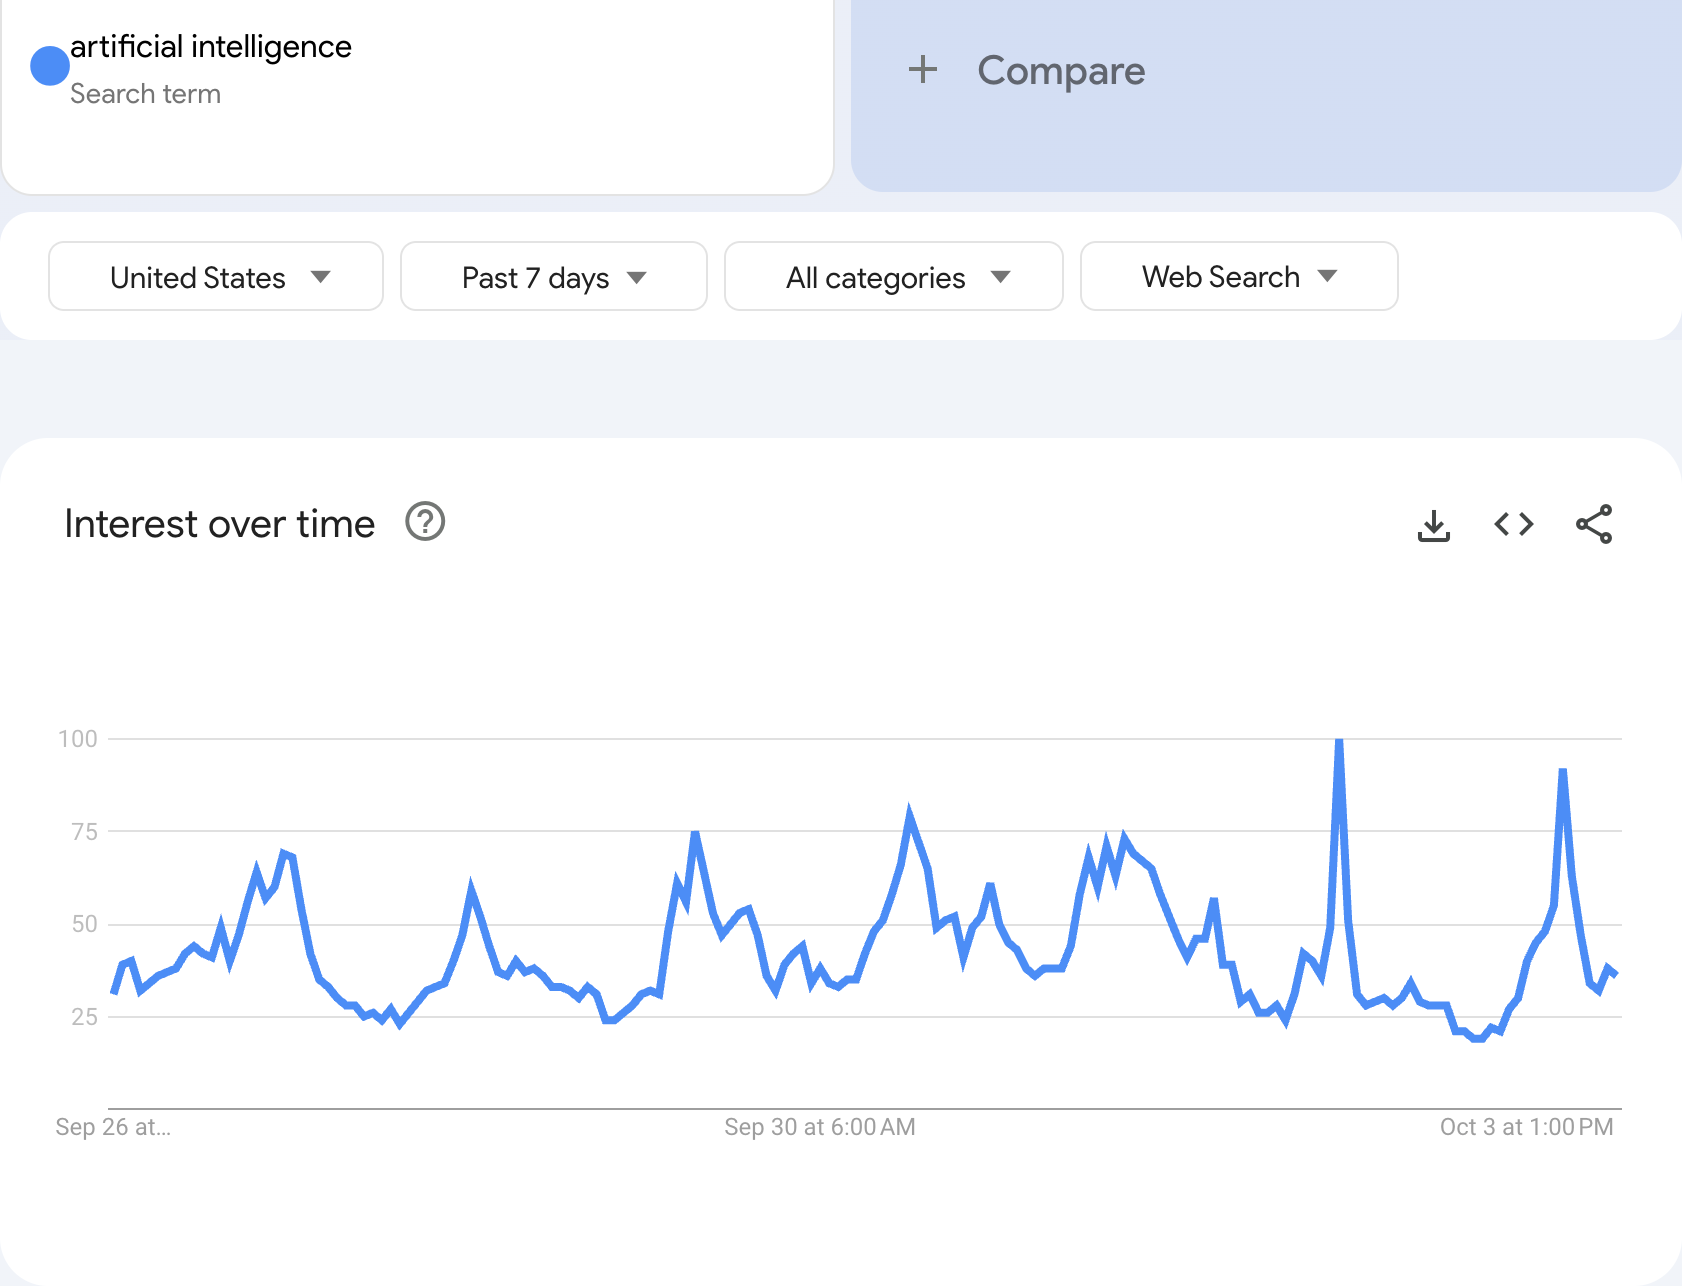
Figure 1: Query settings and interest over time in Google Trends. View source
What kind of popularity Top shows
Google places Top under “Related queries.” According to its official explanation, these are popular related queries that occur in the same search session as the input term within the selected scope.
The DataForSEO endpoint used for this collection defines Top values as relative scores: the most frequently searched query in the list is assigned 100, and 50 means half its search frequency.
In this collection, what is artificial intelligence scored 58 and what is ai scored 20. These values represent the relative popularity of the two terms within the same group of related queries.
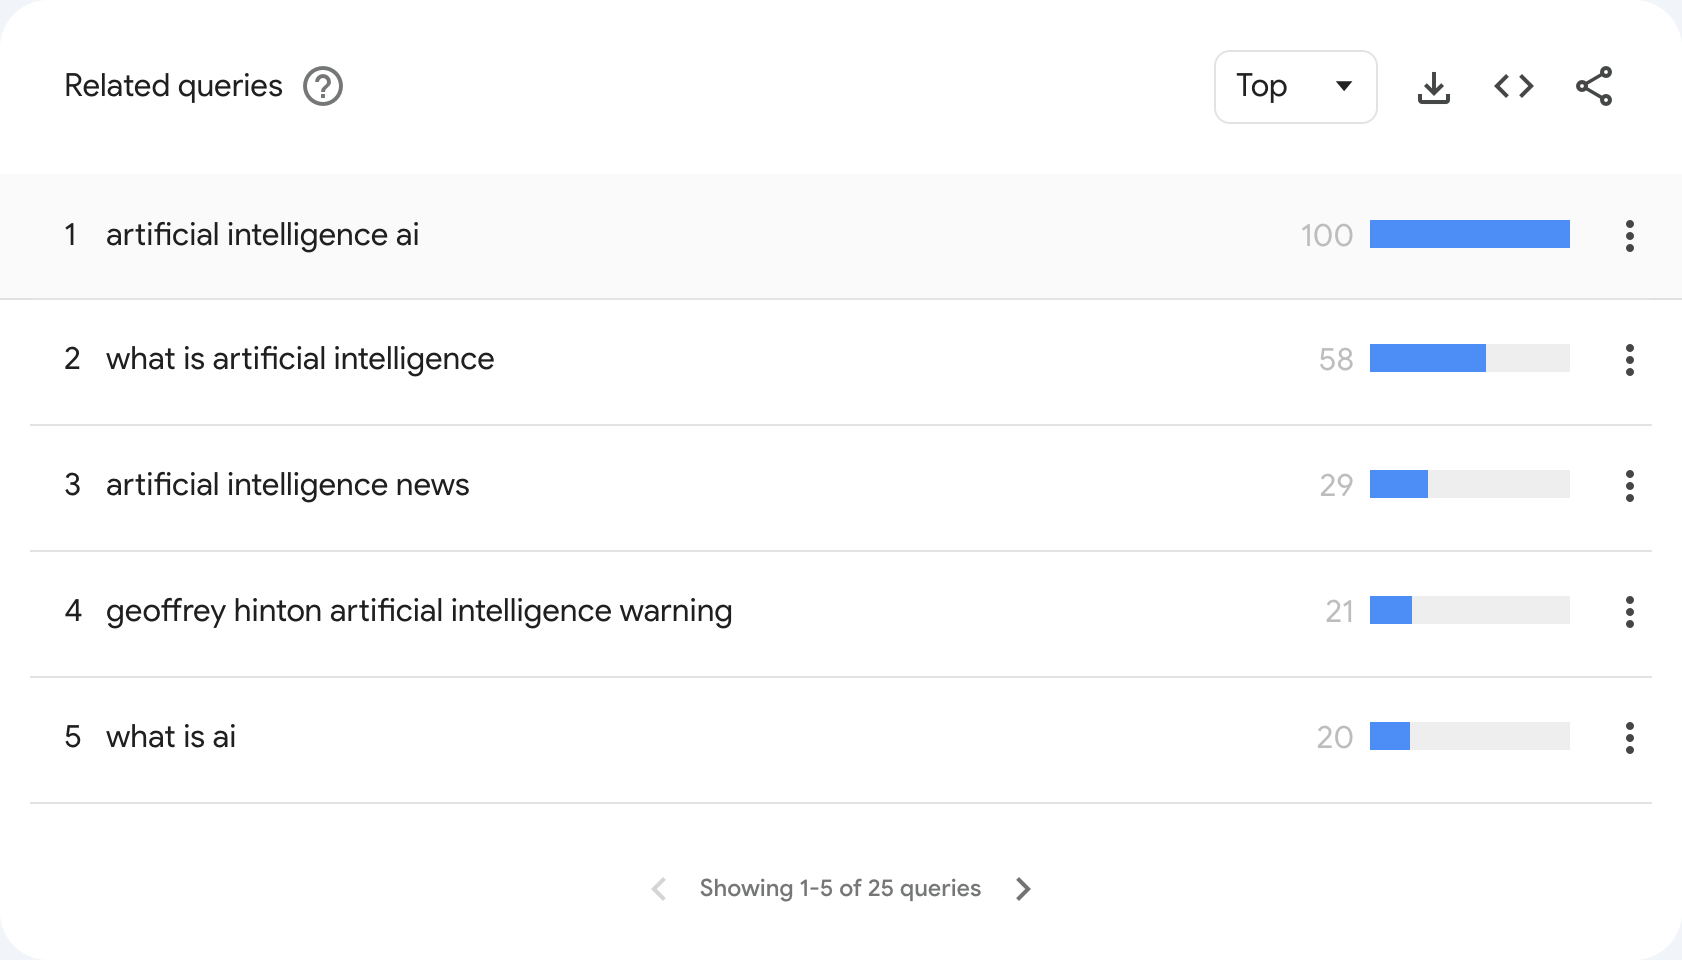
Figure 2: Related queries in the Top view. View source
To see how interest in a particular term changes over time, enter it on its own in Trends and look at the “Interest over time” chart. I first find terms through related queries, then use the time series to examine their recent trends.
Rising shows change
Rising focuses on growth. Google’s data tutorial explains that when you select the past 7 days, the comparison is with the preceding 7 days.
After seeing 12000% in this collection, the next thing to check is the query’s earlier scale.
Let’s use hypothetical search counts and the standard growth-rate formula. Suppose there were 10 searches in the earlier period and 1210 in the later period:
(1210 - 10) / 10 × 100% = 12000%Another hypothetical case has 100 searches in the earlier period and 12100 in the later one. The result is also 12000%. The search volumes in the two cases differ by a factor of 10, yet the percentage growth is the same. To interpret that growth, we also need to know the starting base.
For terms with large increases, I prioritize checking monthly search volume and search results, then estimate how much time the topic is worth.
Google also uses the label Breakout on its page. Its official definition is growth of more than 5000%.
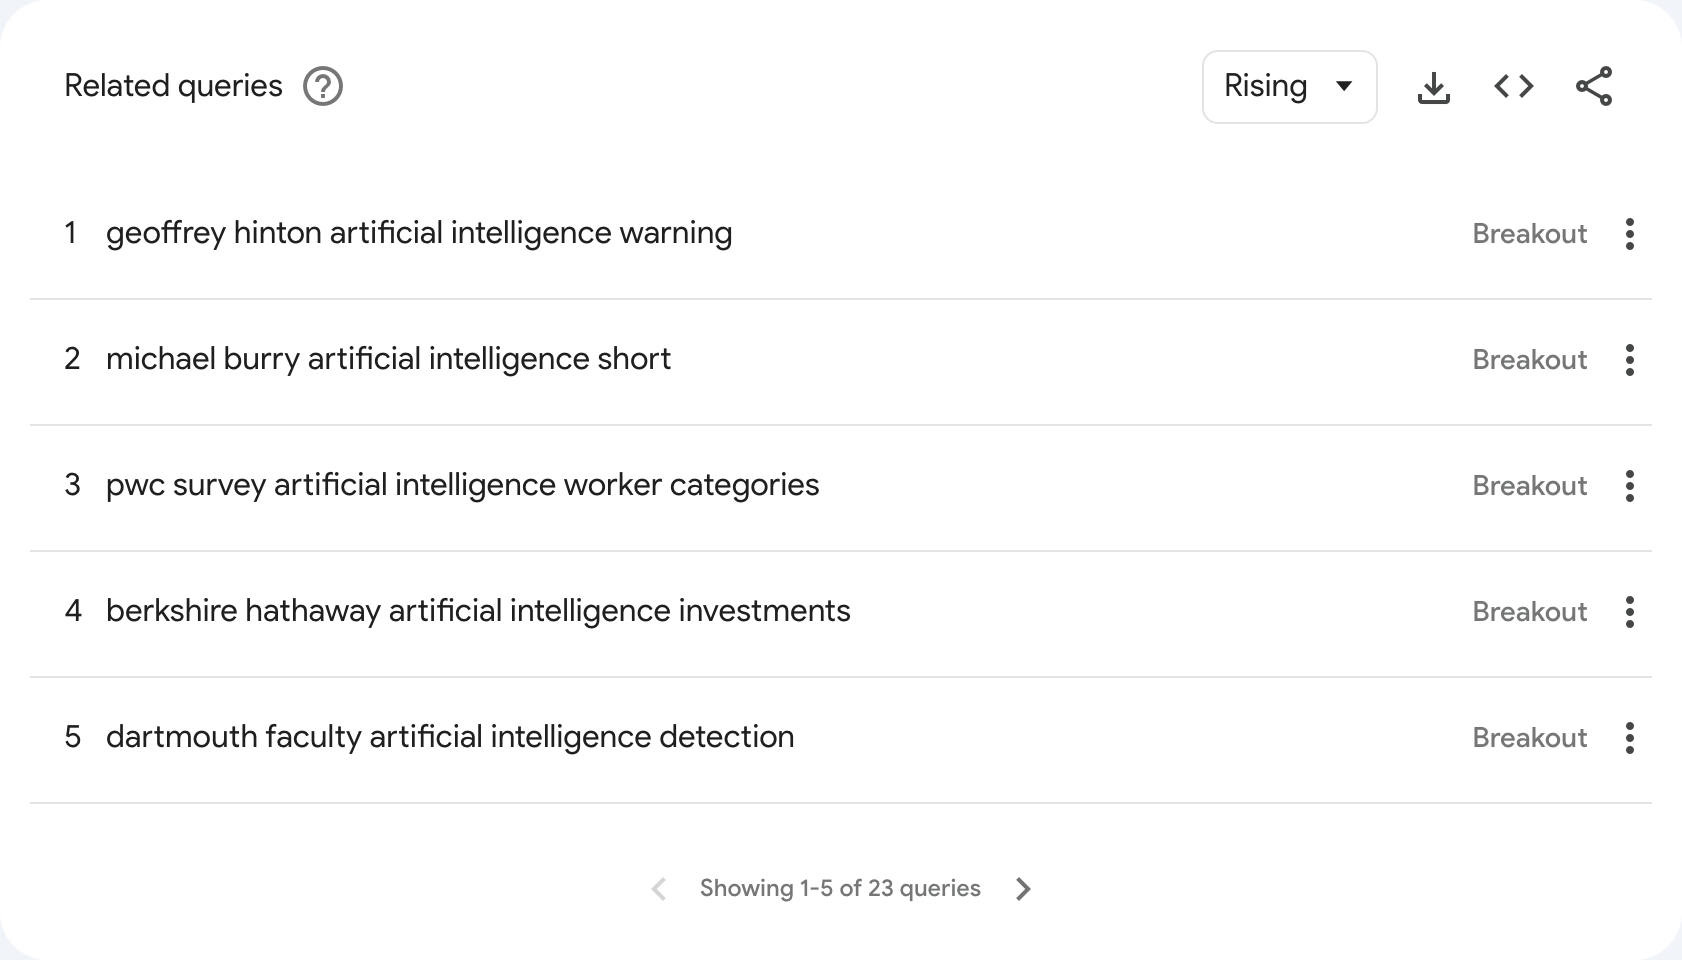
Figure 3: The Rising view, where several queries are labeled Breakout. View source
How I handle missing search volume
Monthly search volume is currently blank for all three terms. When I obtain the data, I will add the values, sources, regions, and corresponding months.
Google’s data explanation says that terms with low search volume may appear as 0. When that happens, I record it as “Trends shows 0; absolute search volume still needs to be checked.”
When recording monthly search volume, I also specify whether it is a value for one month or an average over a period. That way, when I return to the 7-day growth figure, I know which period the monthly volume covers.
My sequence for choosing a topic
-
Record the collection scope. Keep the input term, region, time window, and collection time, and save Top, Rising, and monthly search volume separately.
-
Examine the specific question. Open the search results for the related query and see whether people are learning a concept, looking for a tutorial, or seeking a tool they can use directly.
-
Add scale and review existing content. Look up monthly search volume and record the result and how the data are defined. Read a few existing articles to see which questions are already explained clearly and which content is outdated or lacks practical verification.
-
Gather the material I can provide. Original records, reproducible steps, code, and comparative experiments can all become part of an article. Decide what to write based on the material at hand.
Returning to law firms adopting artificial intelligence, the next step is to look up search volume, extend the time range to examine the trend, and read the relevant search results again before deciding whether to write a separate article about it.