Artificial Analysis Intelligence Index: speed and cost per task explained
Read v4.3.2 weights, speed, and cost definitions, then reproduce a synthetic ledger for cache usage, reasoning tokens, retries, and cost per accepted task.
Suppose you are adding a model to a developer tool. It receives a build log and returns an error category, supporting lines, and a next command in a specified JSON Schema. One candidate leads on intelligence, another on speed, and another on cost. Which should you choose? Start by defining success: the JSON parses, the classification has evidence, and the command fits the environment. Then compare waiting time and the cost of completing that job. A leaderboard narrows the candidates; your own log samples support the final choice.
This article checks the composition and billing definitions of the Artificial Analysis Intelligence Index, then uses a runnable synthetic ledger to explain caching, reasoning tokens, and failed attempts. The methodology was checked on October 6, 2026, when the published version was v4.3.2. Every worked price and task outcome below is invented. No model API was called for this article.
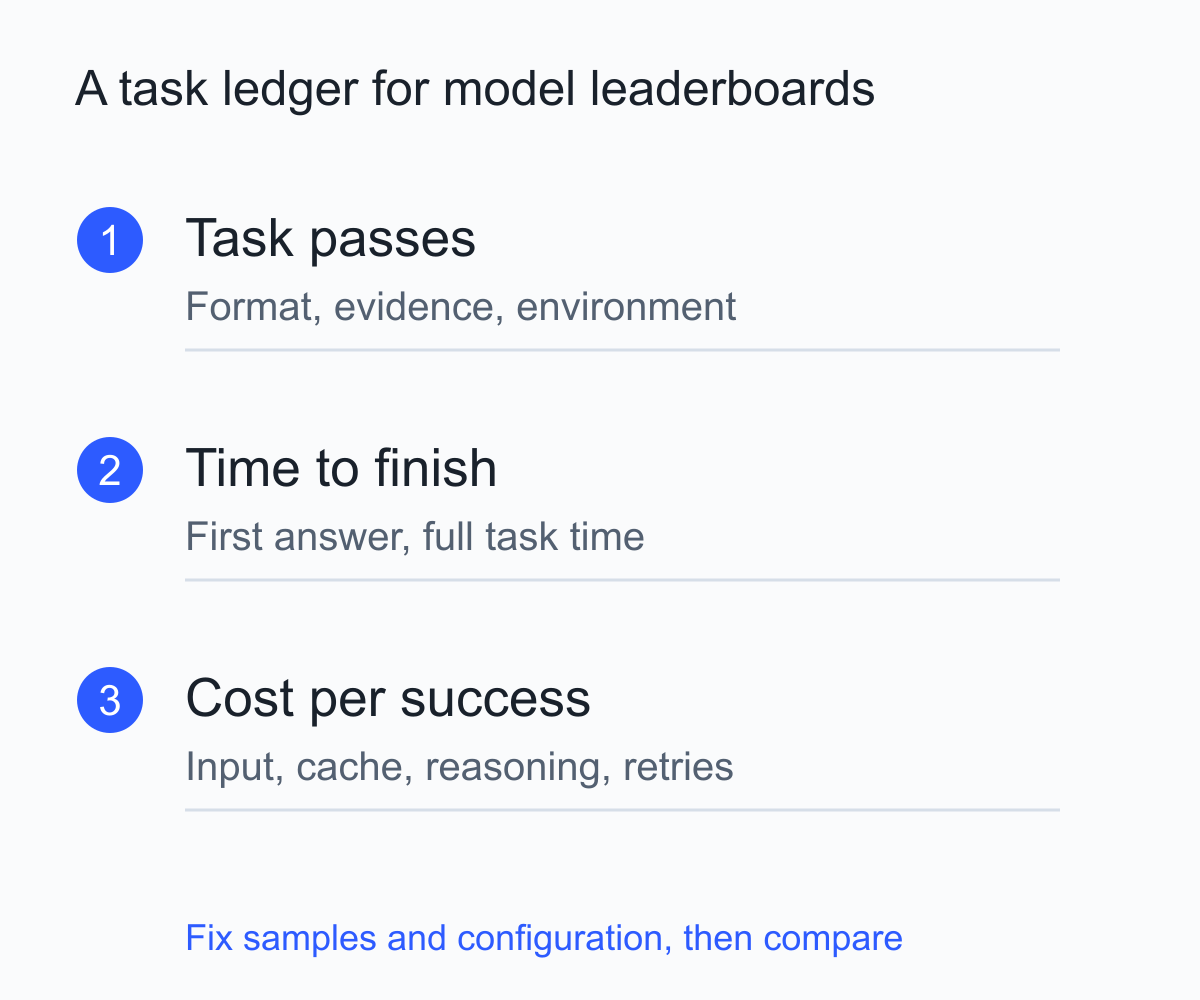
Separate the three numbers on the homepage
The Artificial Analysis homepage presents Intelligence, Speed, and Cost per Task together. Keep the full model configuration when recording a result: reasoning effort, any fallback setting, and the API provider. Changing the effort level or endpoint can change both behavior and the bill.
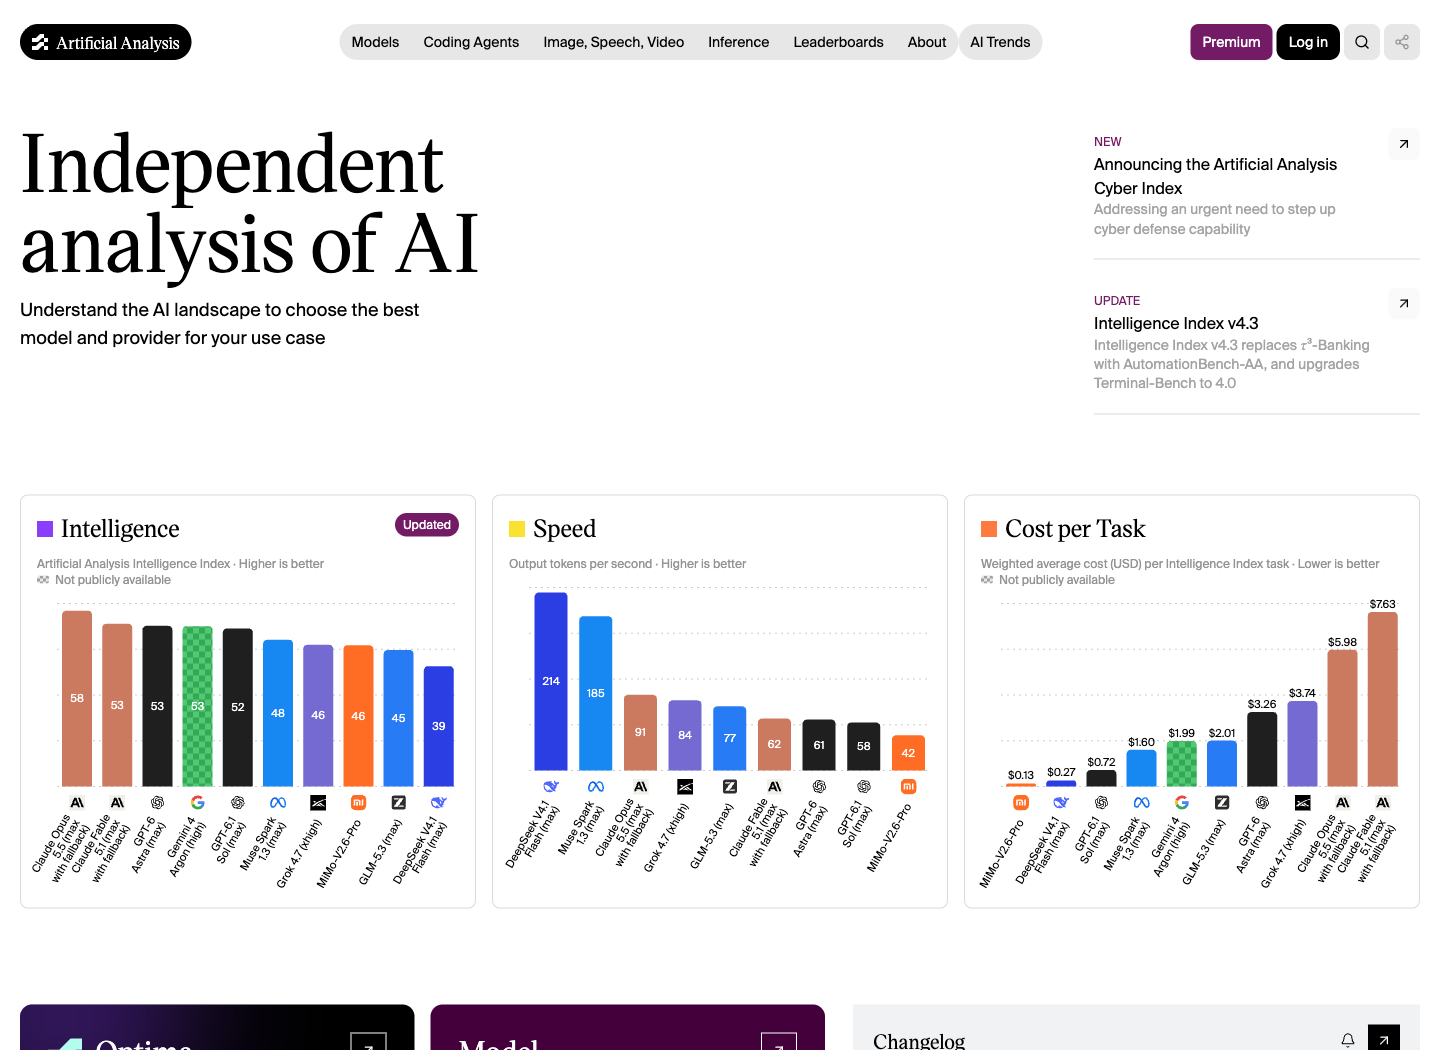
Intelligence, speed, and cost per task on the Artificial Analysis homepage. Source: official website. Open the full-size screenshot to read the chart labels.
| Metric | The question it answers | What to check next |
|---|---|---|
| Intelligence Index | How does a model score across this evaluation mix? | Relevant sub-evaluations, language, tools, and success criteria |
| Speed | How quickly are tokens generated after the first token arrives? | First visible answer, full task duration, and slower requests |
| Cost per Task | With Index weights, how many API dollars does an average evaluation task consume? | Your input, cache use, reasoning, retries, and success rate |
These can work together as filters. Background log classification may tolerate a longer wait but require reliable formatting; interactive completion may have a strict first-answer latency limit. Define the constraints first, then compare costs among candidates that satisfy them.
How Intelligence Index v4.3.2 is composed
The official Intelligence Benchmarking methodology lists ten evaluations, weighted across four capability groups. Every percentage below is a share of the whole Index; they sum to 100%.
| Category and total weight | Evaluation | Index weight | Main task |
|---|---|---|---|
| Agents 30% | AA-Briefcase v1.1 | 15% | Long-horizon knowledge work producing files |
| Agents 30% | GDPval-AA v2.1 | 10% | Real-world work deliverables across occupations |
| Agents 30% | AutomationBench-AA | 5% | SaaS workflows using REST API tools |
| Coding 20% | Terminal-Bench 4.0 | 10% | Task execution and testing in a terminal |
| Coding 20% | SciCode | 10% | Python subproblems for scientific computing |
| Scientific Reasoning 20% | Humanity’s Last Exam | 10% | Difficult knowledge and reasoning |
| Scientific Reasoning 20% | CritPt | 10% | Physics research problems |
| General 30% | AA-Omniscience | 15% | Accuracy 10% plus non-hallucination rate 5% |
| General 30% | GDP.pdf | 10% | Professional reasoning over long PDFs |
| General 30% | AA-LCR v1.1 | 5% | Long-context reasoning |
AA-Omniscience is one evaluation contributing two components, giving ten evaluations and eleven weighted components. Its standalone AA-Omniscience Index is also a different metric from those two components.
Raw evaluation scores use different scales. Terminal tasks can be graded by test outcomes; work deliverables use Elo. For AA-Briefcase and GDPval-AA, Artificial Analysis freezes Elo when a model is added and normalizes it with clamp((Elo - 500) / 2000) before inclusion. Adding raw Elo directly to another evaluation’s accuracy would change the methodology. The composite Index score also does not directly give the success percentage for your application.
Versions affect comparability. The official history says v4.3 replaced τ³-Banking with AutomationBench-AA and upgraded the terminal evaluation to Terminal-Bench 4.0. Version v4.3.2 changed the Elo fitting for GDPval-AA v2.1 and AA-Briefcase v1.1. Save the methodology version with a leaderboard snapshot; inspect composition and scoring changes before interpreting movement across versions as model improvement.
For our log classification task, document reasoning, knowledge reliability, and format success may be particularly relevant. Broad terminal-agent capability supplies only part of the evidence. The Index is primarily an English, text-based suite; Artificial Analysis evaluates images, speech, and multilingual capability separately. Chinese logs, repository terminology, and your custom Schema belong in your own sample set.
The table’s repeats have a specific meaning too. Artificial Analysis generally aggregates pass@1 over independent repeated runs. Repeats do not automatically describe a product flow that revises a prompt after failure. Specify how many retries your application permits and whether the next attempt receives the previous error.
Read Speed alongside first-answer and completion time
The general methodology page defines Output Speed as tokens generated after the first token arrives divided by the remaining generation time; the formula subtracts the first token chunk. Performance comparisons use the o200k_base tokenizer for a common unit. Keep these standardized speed tokens separate from the native tokens used for provider billing.
Three waiting-time measures matter:
- Time to First Token: request sent to first response token. A model exposing reasoning tokens may return reasoning first.
- Time to First Answer Token: input processing and thinking time before the answer starts.
- End-to-End Response Time: input processing, reasoning, and answer generation through the complete response. The website models this metric using average reasoning tokens plus 500 answer tokens; measure the actual completion time for your workload.
Consider a separate synthetic timing example. Model A waits four seconds before its answer and generates at 100 tokens/s. Model B waits 0.5 seconds and generates at 50 tokens/s. With exactly 100 subsequent answer tokens, ignoring chunking and other overhead, A takes about 4 + 100 / 100 = 5 seconds; B takes 0.5 + 100 / 50 = 2.5 seconds. At 1,000 answer tokens, those estimates become 14 and 20.5 seconds. Answer length changes which candidate finishes sooner.
Agent tasks also include tool calls, network waits, sandbox work, and multiple input turns. The website labels Time per Intelligence Index Task as weighted decode time excluding TTFT and overhead. For a tool’s timeout budget, record actual full-task p50, p95, and timeout outcomes.
Where Cost per Task gets its weights and dollars
Artificial Analysis multiplies consumed input, cached, and output tokens by the corresponding prices. It calculates the mean cost within each evaluation, then combines those means using the same per-evaluation weights as the Intelligence Index:
Cost per Task = Σ [evaluation weight × (evaluation token cost / evaluation task count)]An evaluation does not receive greater weight simply because it has more questions. Consider a separate toy evaluation suite. X contains two tasks costing $0.40 in total, with a 25% weight. Y contains eight tasks costing $0.40, with a 75% weight. Its weighted result is 0.25 × 0.40 / 2 + 0.75 × 0.40 / 8 = $0.0875. Pooling all costs and dividing by ten tasks gives $0.08, representing a different task distribution. These invented weights only illustrate the arithmetic.
For evaluation costs, Artificial Analysis uses token counts reported by model API providers, with a canonical-tokenizer fallback in the few cases where counts are unavailable. Prices use first-party API rates or the median across providers. Cache costs vary by provider. Displayed cache rates and costs incorporate recent measurements of representative cache hit rates, so they can differ from the one-off cache record when an evaluation originally ran.
Another metric is Blended Price. The current general methodology uses a 7:2:1 ratio of cache-hit, input, and output prices: (7 × cache-hit price + 2 × input price + output price) / 10. This compares rates under a fixed mix. Cost per Task changes with actual generation length and reasoning usage. Calculate each separately; do not apply the fixed blended ratio again to a task ledger.
Put a task into disjoint token buckets
This is a synthetic example. Every rate and token count is invented and corresponds to no real model or current price. Assume these rates per million native tokens: ordinary input $2, cache writes $2.50, cache hits $0.20, and both reasoning and answer output $8. In this example the cache-write rate replaces the ordinary input rate. Adapt the ledger to a real service’s rules for write surcharges, cache storage, or long-context pricing.
A log-analysis task receives 12,000 input tokens: 10,000 reusable context tokens and 2,000 tokens of current logs. The first attempt writes the cache, generates 1,500 reasoning tokens and 500 answer tokens, and fails Schema validation. The retry assumes all 10,000 context tokens hit the cache, still includes 2,000 new input tokens, and generates 1,000 reasoning tokens plus 600 answer tokens. This attempt passes validation.
| Disjoint billing bucket | First attempt: failed | Retry: passed | USD/million tokens |
|---|---|---|---|
| Ordinary input | 2,000 | 2,000 | $2 |
| Cache write | 10,000 | 0 | $2.50 |
| Cache hit | 0 | 10,000 | $0.20 |
| Reasoning output | 1,500 | 1,000 | $8 |
| Answer output | 500 | 600 | $8 |
First attempt:
(2,000 × 2 + 10,000 × 2.50 + (1,500 + 500) × 8) / 1,000,000
= $0.045
Retry:
(2,000 × 2 + 10,000 × 0.20 + (1,000 + 600) × 8) / 1,000,000
= $0.0188
The task costs $0.0638 across both attempts. We assume the failed first generation is fully charged. Check provider billing rules and usage records for real API errors; a status code alone does not establish whether a request was charged.
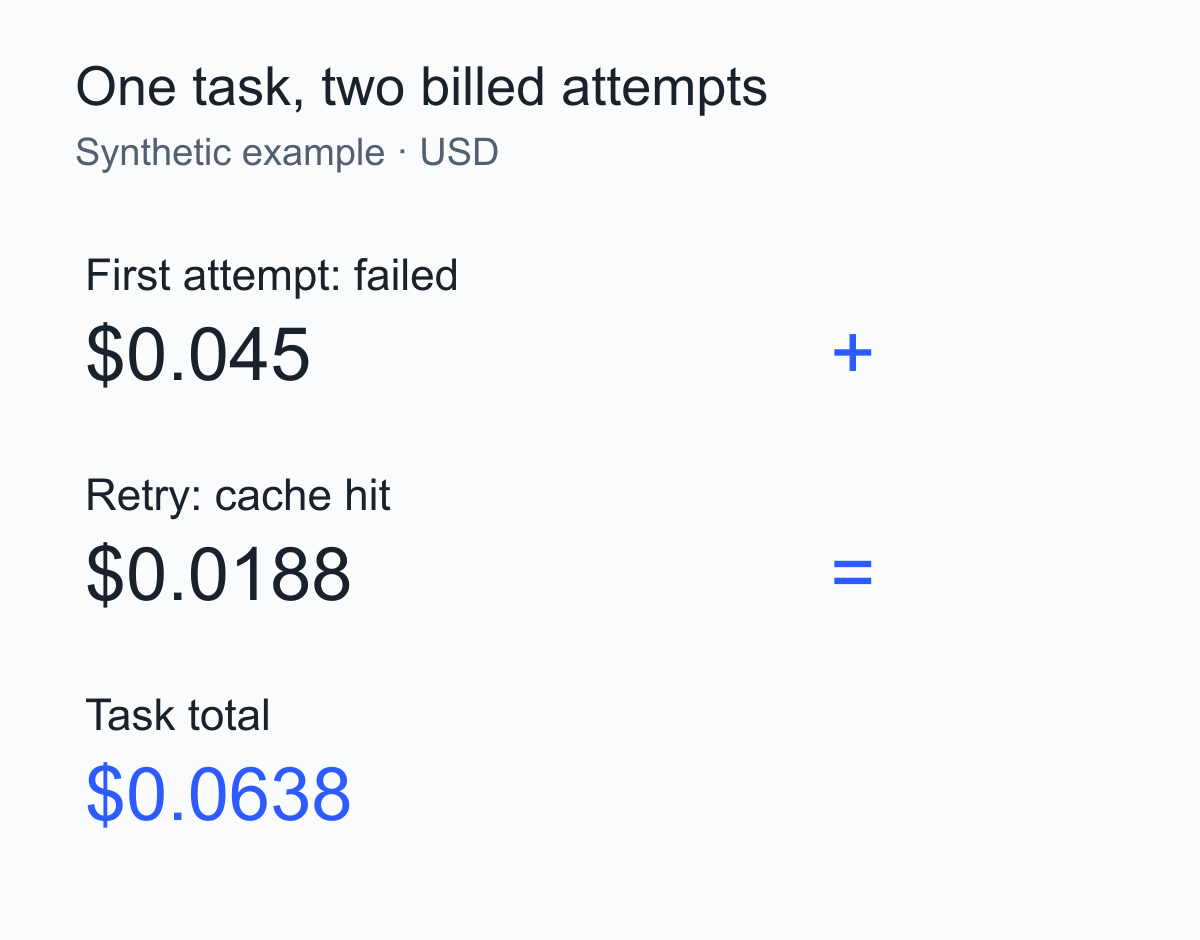
Two requests for one task, billed separately and added together.
Before reading usage fields into the ledger, check which fields contain subsets. If output_total=2,000 already includes reasoning=1,500, answer output is 500. Adding 2,000 + 1,500 would count reasoning twice. Input should likewise satisfy total_input = ordinary input + cache write + cache hit. If a provider includes cache hits in total input, subtract them before finding the ordinary portion. The five buckets in this example do not overlap.
Cache hits are conditional. A changed system prompt, expired cache, or incompatible prefix can produce new write charges or ordinary input charges on a retry. The 100% hit rate for cacheable tokens here is a simplifying assumption.
Record both cost per submission and cost per success
Using the attempt costs above, suppose eight of ten distinct tasks pass on the first attempt and two pass after the illustrated retry. Total cost is 8 × 0.045 + 2 × 0.0638 = $0.4876. Cost per submitted task and cost per successful task are both $0.04876. There are twelve API requests.
Now consider a separate scenario: ten tasks each receive only a first attempt, with eight passes and two failures. Total cost is $0.45, cost per submission is $0.045, and cost per success is $0.45 / 8 = $0.05625. Changing the denominator changes the question answered. Whether retries are worthwhile also depends on the importance of failed tasks, added waiting time, and human review.
Download the script, CSV ledger, and selection template, extract the archive, and run python3 calculate.py. The script uses only the Python standard library, makes no network requests, and writes attempts.csv and results.json. Assertions check the worked costs and both kinds of averages.
For the log tool at the start, I would organize the next evaluation with this table. Its thresholds are example requirements to adapt to your product; actual candidate results remain blank until testing.
| Selection item | Example constraint and record | Role in the decision |
|---|---|---|
| Task and samples | Twenty fixed, redacted logs spanning build, dependency, permission, and insufficient-information cases; record a sample version | Every candidate sees the same input |
| Success | JSON matches the Schema; category matches evidence; suggested command is usable; missing information is stated | Defines an acceptable output |
| Hard limits | At least 18/20 first-attempt passes and full-task p95 ≤ 8 seconds in this example | Candidates must qualify before cost comparison |
| Billing | Freeze model revision, endpoint, reasoning effort, and prompt; record five token buckets and allowed retries | Explains where money goes |
| Budget | Example maximum $0.06 per success; record total cost/submissions and total cost/successes | Ties spending to accepted deliverables |
| Recovery and review | Record failures, cancellations, timeouts, review minutes, and external tool costs separately | Supports retry, lower-effort, or human-handling decisions |
Twenty samples can expose formatting errors and large differences. If candidates differ by only one or two passes, add representative samples and inspect variation before locking the configuration. The public Model Recommender can further narrow the shortlist. For multi-turn coding agents and routing, continue with coding-agent router quality, cost, and time. A saved selection record should show which constraints a configuration met on a specific task set, how many requests it used, and what an accepted result cost.